

Weekly Fin-Fun Newsletter #105
🚀 Unlock Super Tax Saving Hacks! 🌟 Dive into the Stock & CE of the Weeks 📈, Discover Next Multibaggers 💼, and Gain Insights from Experts Ramesh Damani and Rajeev Thakkar
“Everything is created twice, first in the mind and then in reality.” ― Robin Sharma


Transform your tax planning with the "SIP" strategy!
Introducing Teen Ka Fayda: Save, Invest & Protect to minimize your taxes and maximize your wealth.
With Teen Ka Fayda, you can now:
1. Save Taxes up to Rs. 85,800 in a year
- Rs.46,800 u/s.80C
- Rs.15,600 u/s.80CCD
- Rs.23,400 u/s.80D
2. Invest in a combination of ELSS+NPS to build your wealth and plan your retirement.
3. Protect your wealth during unexpected medical emergencies with comprehensive Health Insurance coverage.
Make use of Teen Ka Fayda today.
Do check out here or drop me a message on Whatsapp
Markets this Week
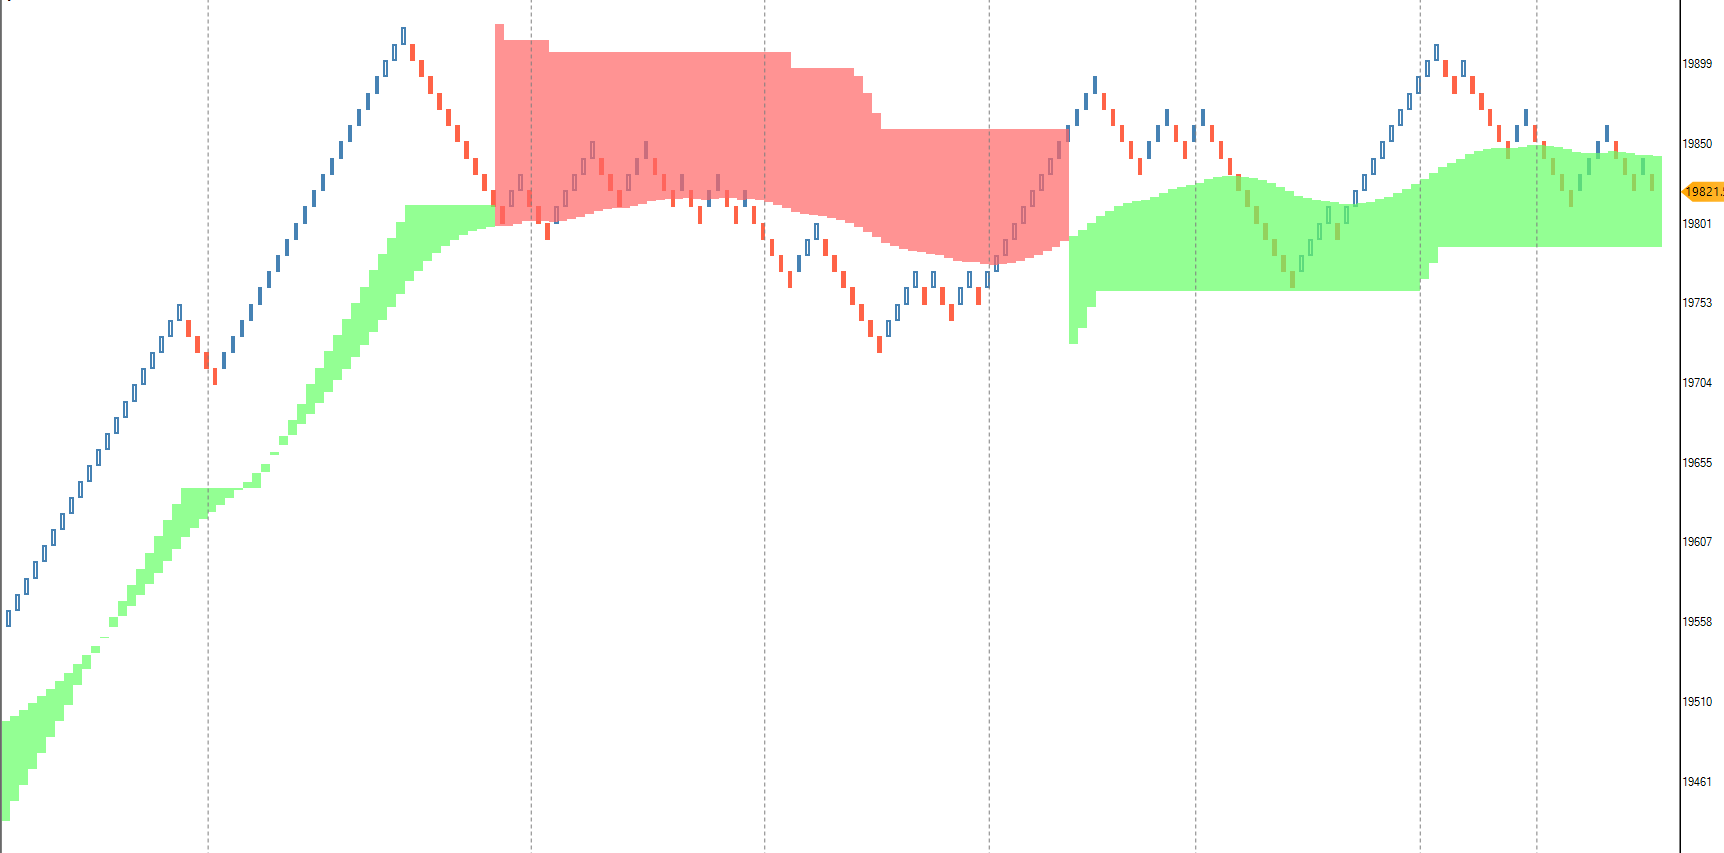
Nifty looking good, Crude and Bonds looking weak .
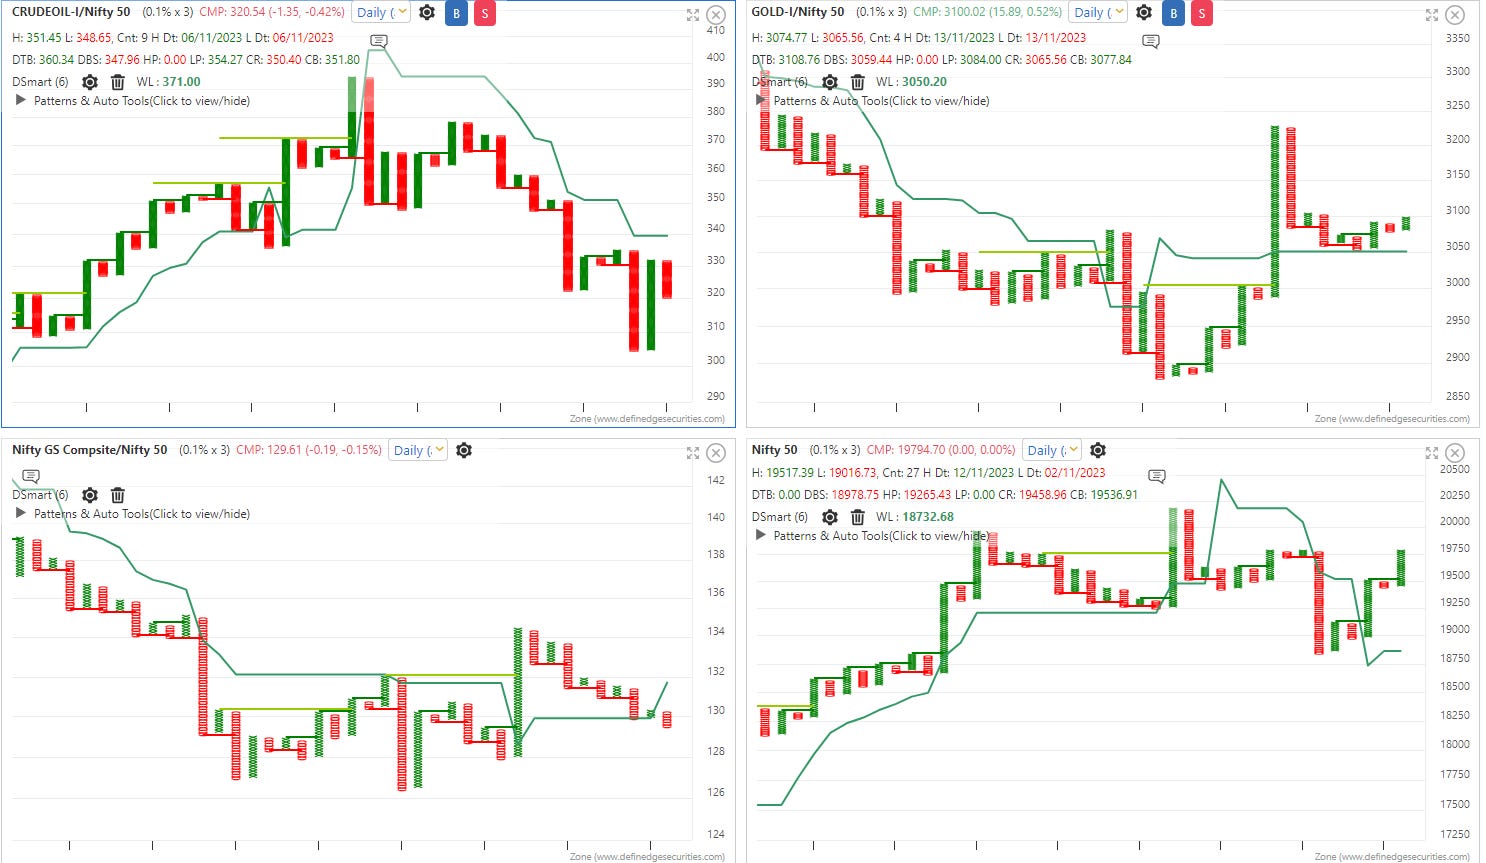
Nifty Longs above 19850 levels only.
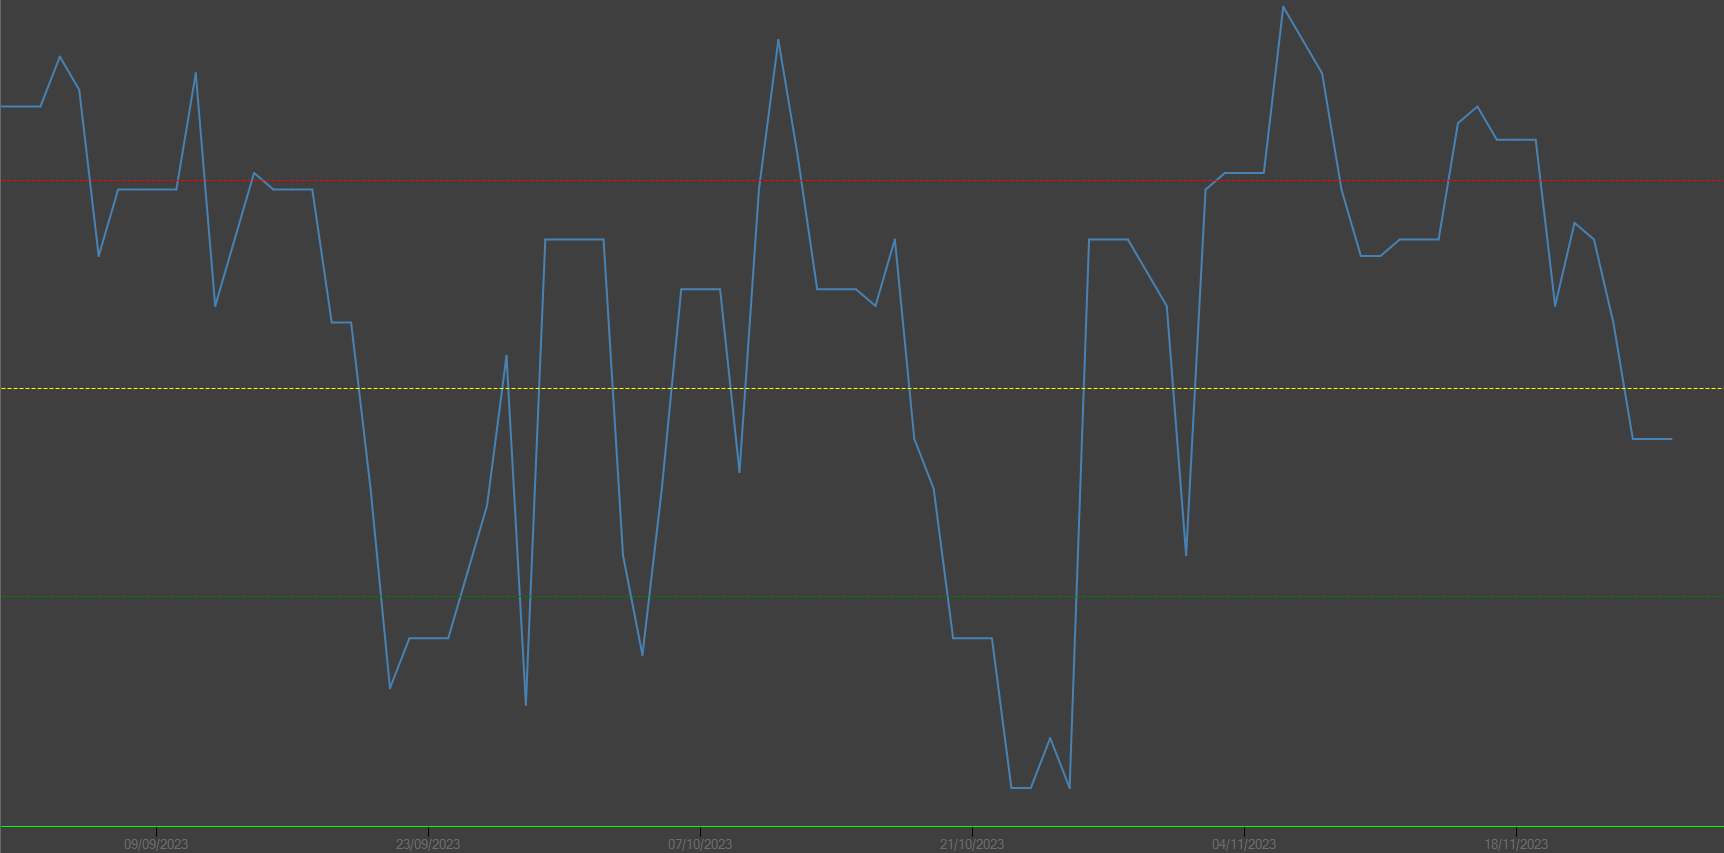
Nifty Breadth at 44 levels..
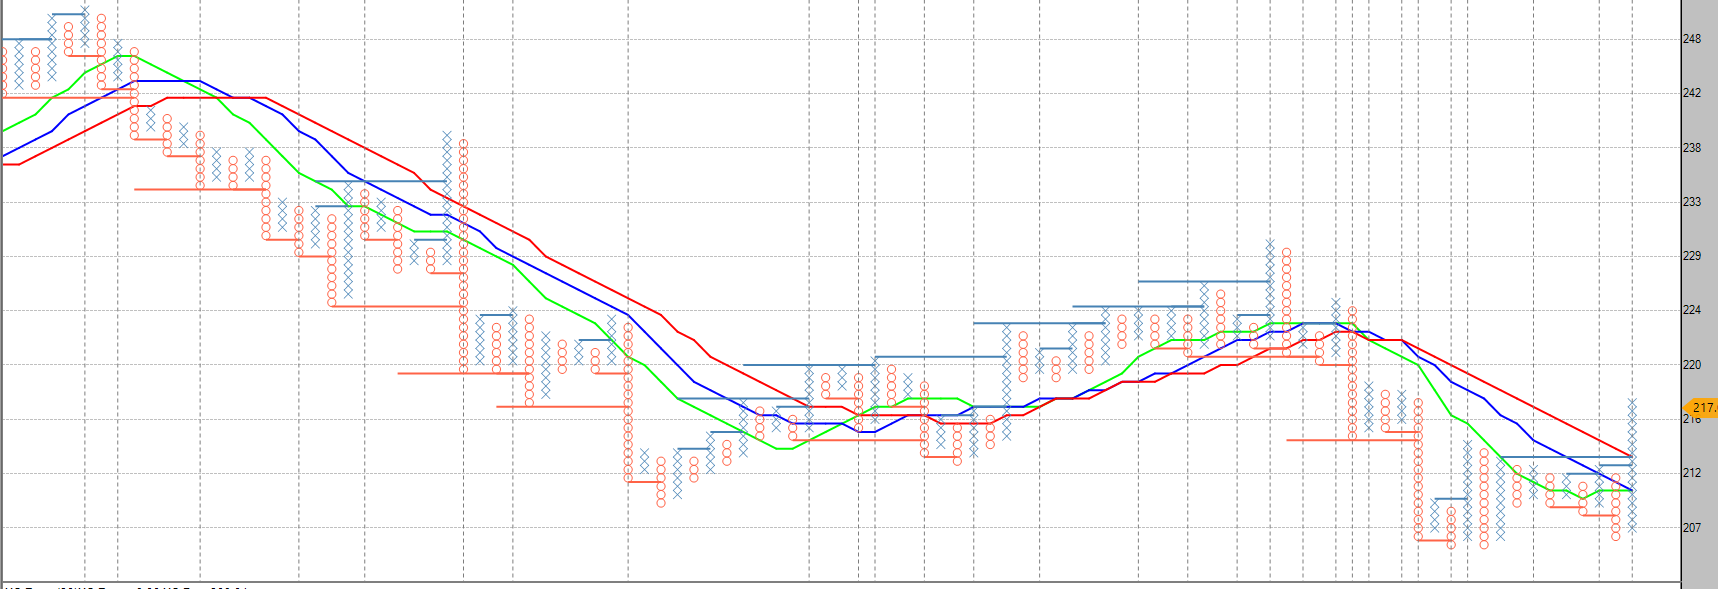
Stock of the Week
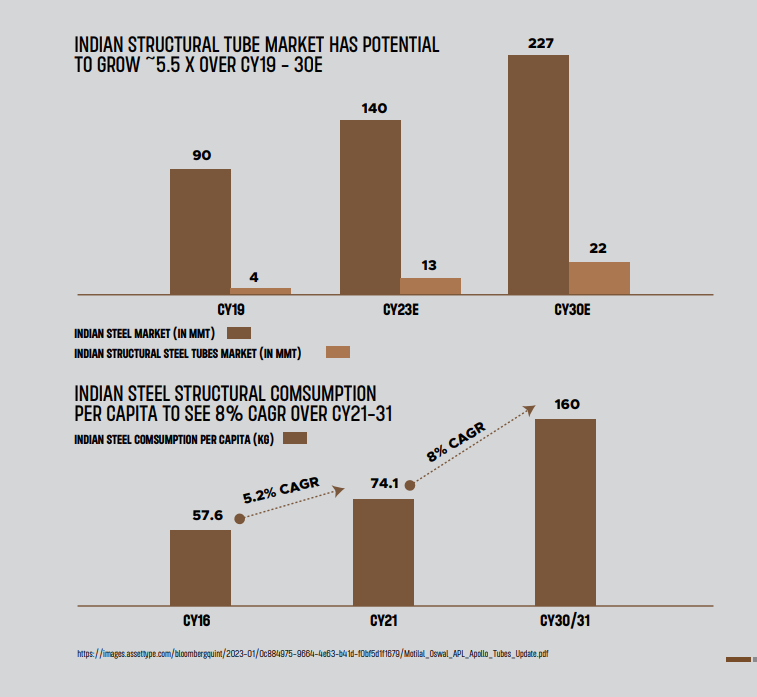
JTL - CMP 216
JTL Infra Ltd is an integrated manufacturer and supplier of steel tubes, pipes and allied products with manufacturing facilities in India.[1]
KEY POINTS
Product Portfolio
The company's product offerings include Electric Resistance Welding (ERW) pipes, galvanized pipes, solar structures, etc. [1]

Perks
Cash Conversion Days 55.89 has improved as compared to 5 Yrs avg Cash Conversion Days 70.66
D/E is 0.17
D/E 0.17 has reduced as compared to last year's D/E 0.49
DII have increased their stakes by 0.37% in the latest quarter (0.7% to 1.07%)
FII have increased their stakes by 1.63% in the latest quarter (0.72% to 2.35%)
Interest Coverage ratio is 20.31
Interest Coverage ratio 20.31 is higher than last year's Interest Coverage Ratio 11.67
Quarterly Profit has grown by 33.59% YoY
Quarterly Profit has grown by 10.05% QoQ
Quarterly Sales has grown by 37.21% YoY
Net Profit Margin (PAT Margin) 5.82% has improved as compared to last year's NPM 4.51%
Operating Profit Margin (EBITDA Margin) 8.35% has improved as compared to last year's OPM 6.6%
PEG ratio is 0.31
Stock has given a return of 43.84% in last 52 Weeks
3 Years Profit CAGR is 107.55%
Annual Profit has grown over by 47.59%
Retail/Public have reduced their stakes by 1.59% in the latest quarter (42.39% to 40.8%)
ROCE is 34.3%
ROCE 34.3% is above the 5 years ROCE average 31.14%
ROE is 35.95%
ROE 35.95% is above the 5 years ROE average 35.29%
3 Years Sales CAGR is 88.84%
Annual Sales has grown by 14.25%

10% of successful stock picking is picking great stocks. The other 90% is not selling them.
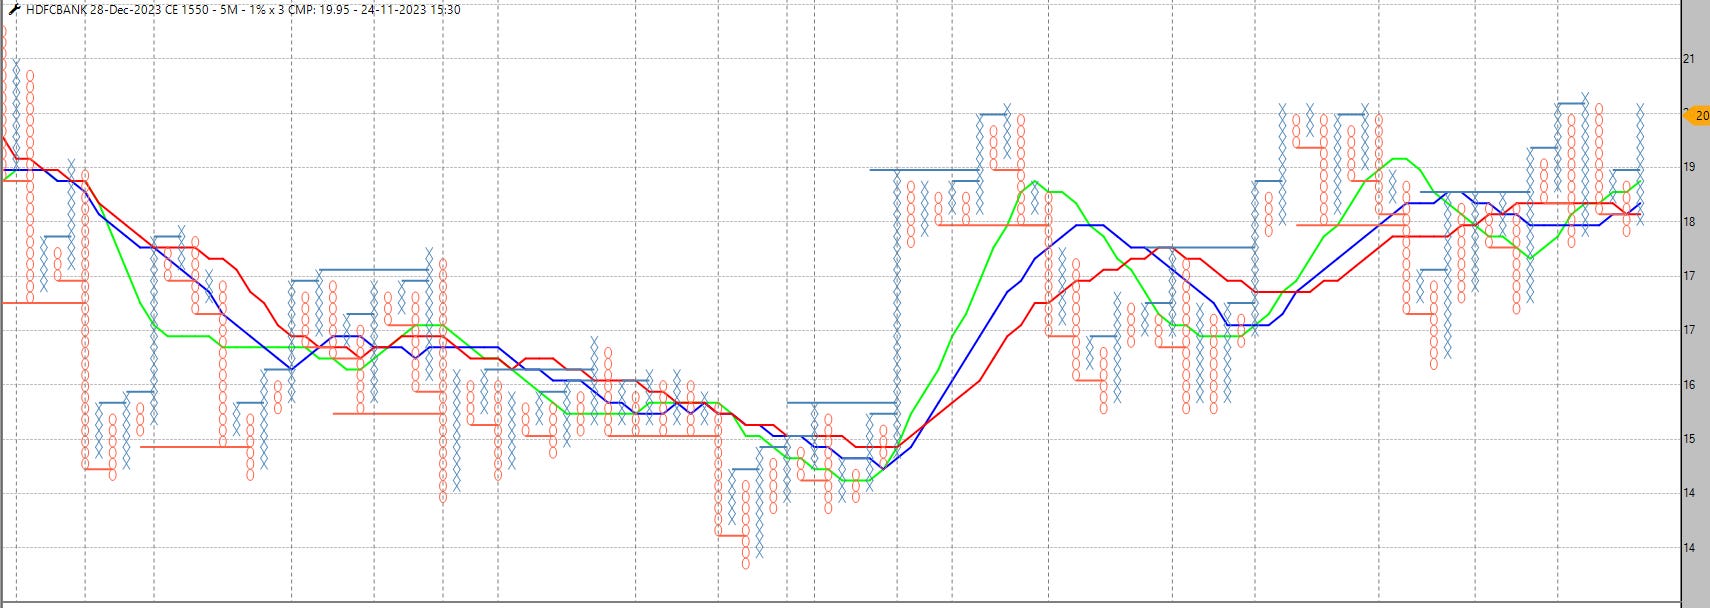
CE of the Week
HDFC 1550 CE December above 21 levels
We wanted to bring to your attention that the charts provided in the attached document or presentation are intended solely for educational purposes. They are not intended to serve as or be construed as financial advice.
The information presented in these charts is meant to enhance understanding and provide educational insights into market trends, patterns, and analysis. However, it is crucial to note that the interpretation and application of this information to actual financial decisions should be done with careful consideration and consultation with a qualified financial professional.
Interesting Reads and Tweets
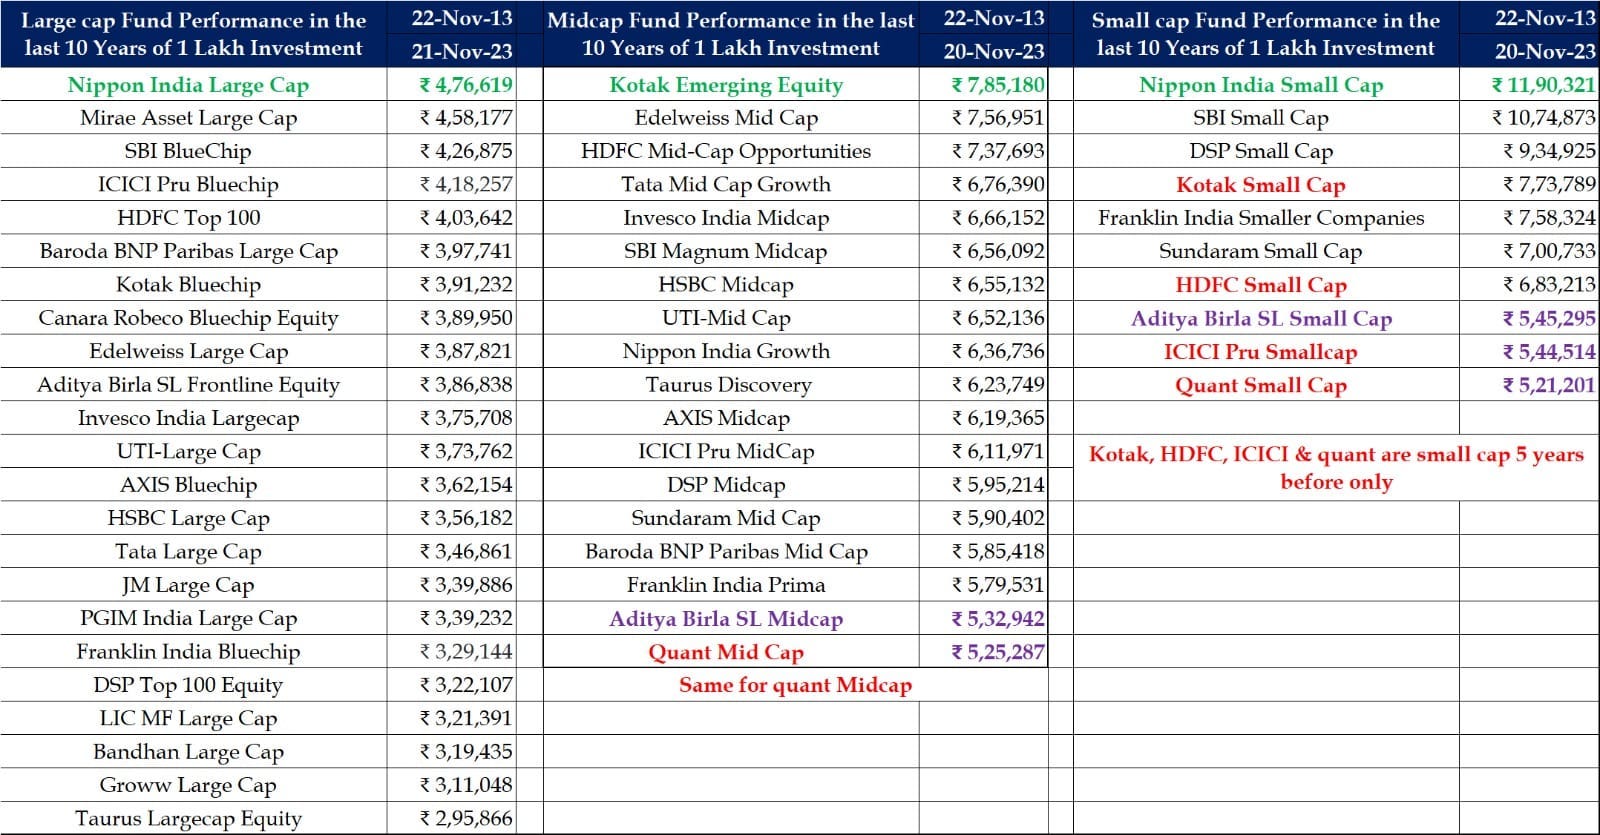
This is the 10-year lump sum investments of large, mid & small cap investments. Worst performance of mid & small cap category delivered more returns than the best large cap fund category.
Though mid & small caps are more volatile than large cap and it is worth considering if investor goal is long term in nature.

Ramesh Damani - Investing Legend and Humble person.