

Weekly Fin-Fun Newsletter #111
Stock, CE, Series, Super Investors, Mohnish Pabrai, Prashant Shah, Shyam Sekhar


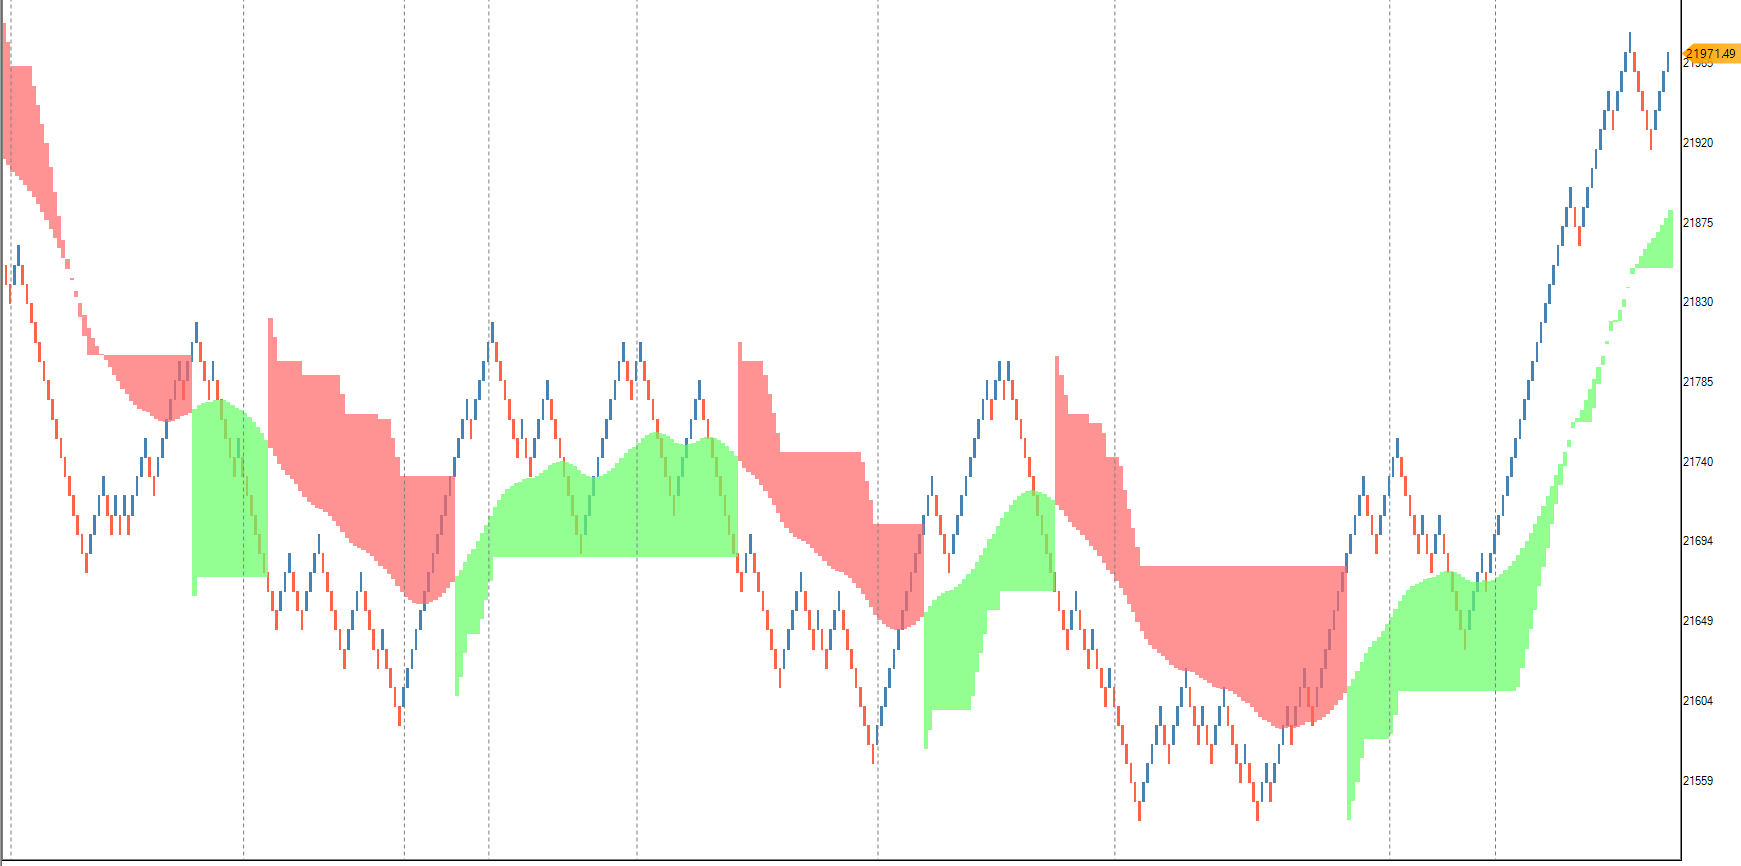
Markets this Week
Repeat story - Nifty continues to outperform Gold, Oil and Bonds
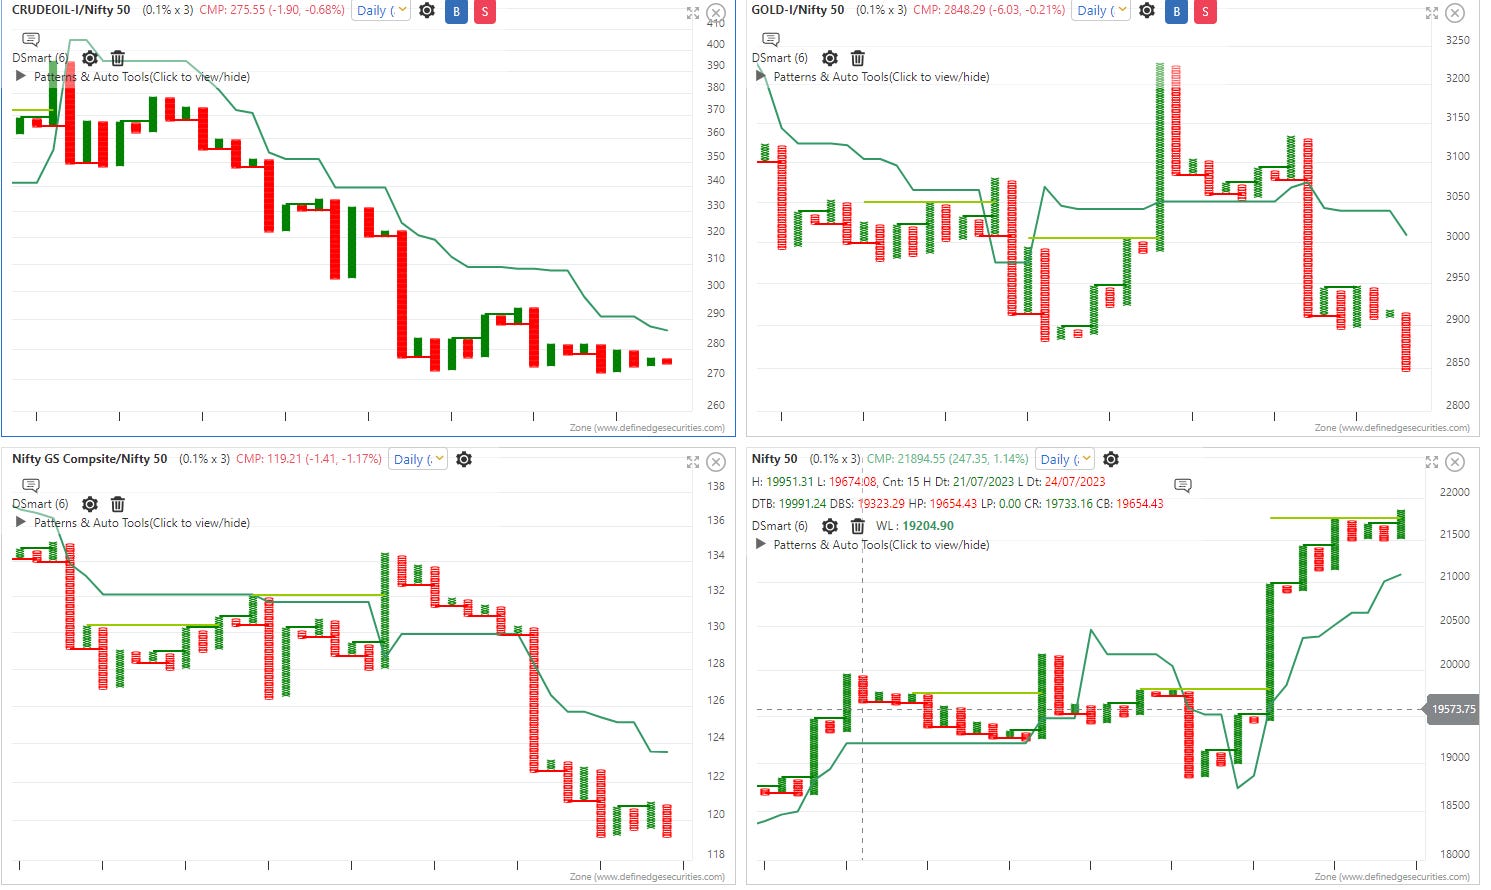
After sideways movement the previous week, Nifty finally broke out on Friday.. One needs to see if they momemtum continues
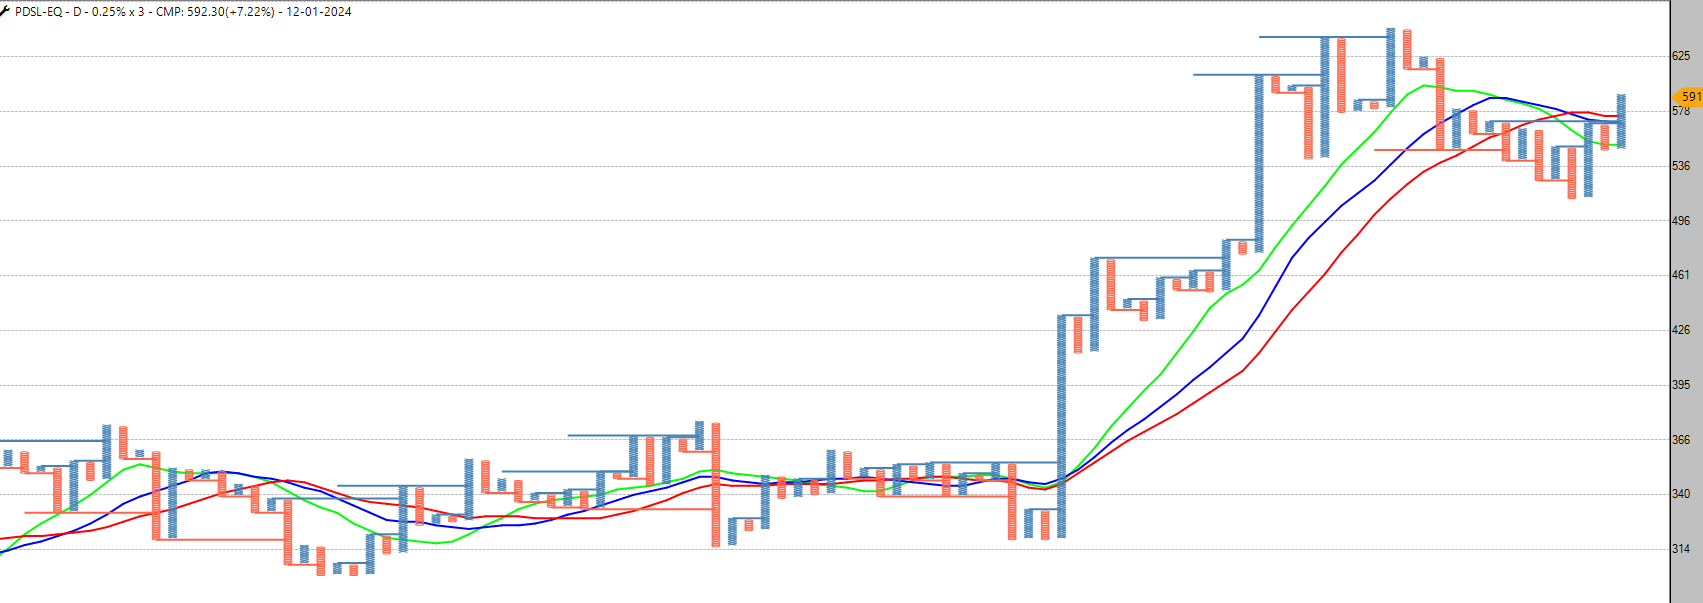
Stock of the Week
PDS Ltd - CMP 591

PDS Ltd is engaged in trading of garments, investment holding, design, development, marketing, sourcing and distribution of readymade garments of all kinds and other consumer products worldwide.[1]
KEY POINTS
Business Segments[1]
1 Design-led Sourcing
2 Sourcing as a Service
3 Manufacturing
4 Brand Management
Sourcing Segment (~96% of revenues)[2]
The company offers various leading brands and retailers a wide range of products, sourced from 600+ partner factories across various countries. Its products include apparel, accessories, footwear, and home products. It has a capacity of ~1 million pieces of garments per day from its partners.
It also has a team of 250+ designers from cities like London, Hong Kong, New York, Barcelona, Shanghai, etc. to track the latest trends in the fashion industry. [3] [4] [5][6]
Revenue Breakup FY23[7]
Men's Wear - 40%
Ladies Wear - 34%
Kids Wear - 21%
Essentials - 1%
Others - 4%
Global Presence[8][9]
The company has a global presence across 22+ countries with sourcing and manufacturing operations in countries like Bangladesh, China, Egypt, India, Jordan, Myanmar, etc. and sales & design operations from Australia, Belgium, Canada, Chile, China, Dubai, Germany, Turkey and other countries. It has 60+ offices.
Perks
Company has a negative Cash Conversion Days of -4.69
Cash Conversion Days -4.69 has improved as compared to 5 Yrs avg Cash Conversion Days 5.19
D/E is 0.59
D/E 0.59 has reduced as compared to last year's D/E 0.73
Dividend Yield is 0.86%
Free Cash Flow yield is 6.58%
FII have increased their stakes by 0.45% in the latest quarter (2.97% to 3.42%)
Quarterly Profit has grown by 297.52% QoQ
Quarterly Sales has grown by 16.45% QoQ
Operating Profit Margin (EBITDA Margin) 4.48% has improved as compared to last year's OPM 3.78%
PEG ratio is 0.65
Stock has given a return of 74.46% in last 52 Weeks
3 Years Profit CAGR is 54.86%
Annual Profit has grown over by 11.59%
Retail/Public have reduced their stakes by 0.26% in the latest quarter (30.37% to 30.11%)
ROCE is 28.31%
ROCE 28.31% is above the 5 years ROCE average 19.56%
ROCE 28.31% has increased as compared to last year's ROCE 26.55%
ROE is 34.95%
ROE 34.95% is above the 5 years ROE average 26.24%
3 Years Sales CAGR is 16.74%
Annual Sales has grown by 19.81%
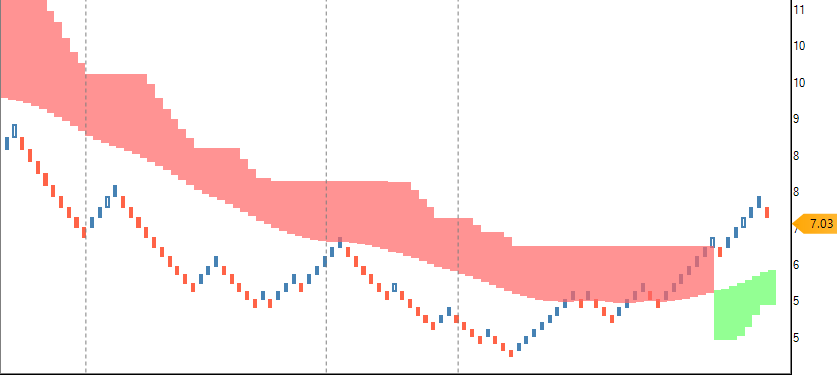
CE of the Week
ITC 467.5 CE - CMP 7
Disclaimer:
The charts provided are for educational purposes only and should not be considered as financial advice. Trading and investing carry inherent risks, and it is essential to exercise diligence and caution when making financial decisions. The information presented in the charts is not intended to be a substitute for professional financial advice or judgment.
Before making any investment decisions, it is strongly recommended that you consult with a qualified financial advisor who can assess your individual financial situation, goals, and risk tolerance. The content provided here is based on historical data and market conditions at the time of creation, and future market movements may vary.
Series of the Week

Killer Soup on Netflix
Interesting Tweets and Reads
Opportunities - H/t Nithin Alphaideas


20 Super Investors - In conversation with Larissa
Prashant Bhai podcast on PnF charts
Learning from the Cycles - Shyam Sekhar
Mohnish Pabrai on companies that thrive in 50% inflation